Conceptual research visuals
Scientific Figure Generator for Conceptual Research Diagrams
Turn a paper abstract, research summary, or rough sketch into a visual draft of a mechanism, workflow, comparison, or system. Abfig helps researchers explore the composition, refine selected regions, and export an RGB PNG or TIFF without starting from a blank canvas.
Create a Scientific Figure Draft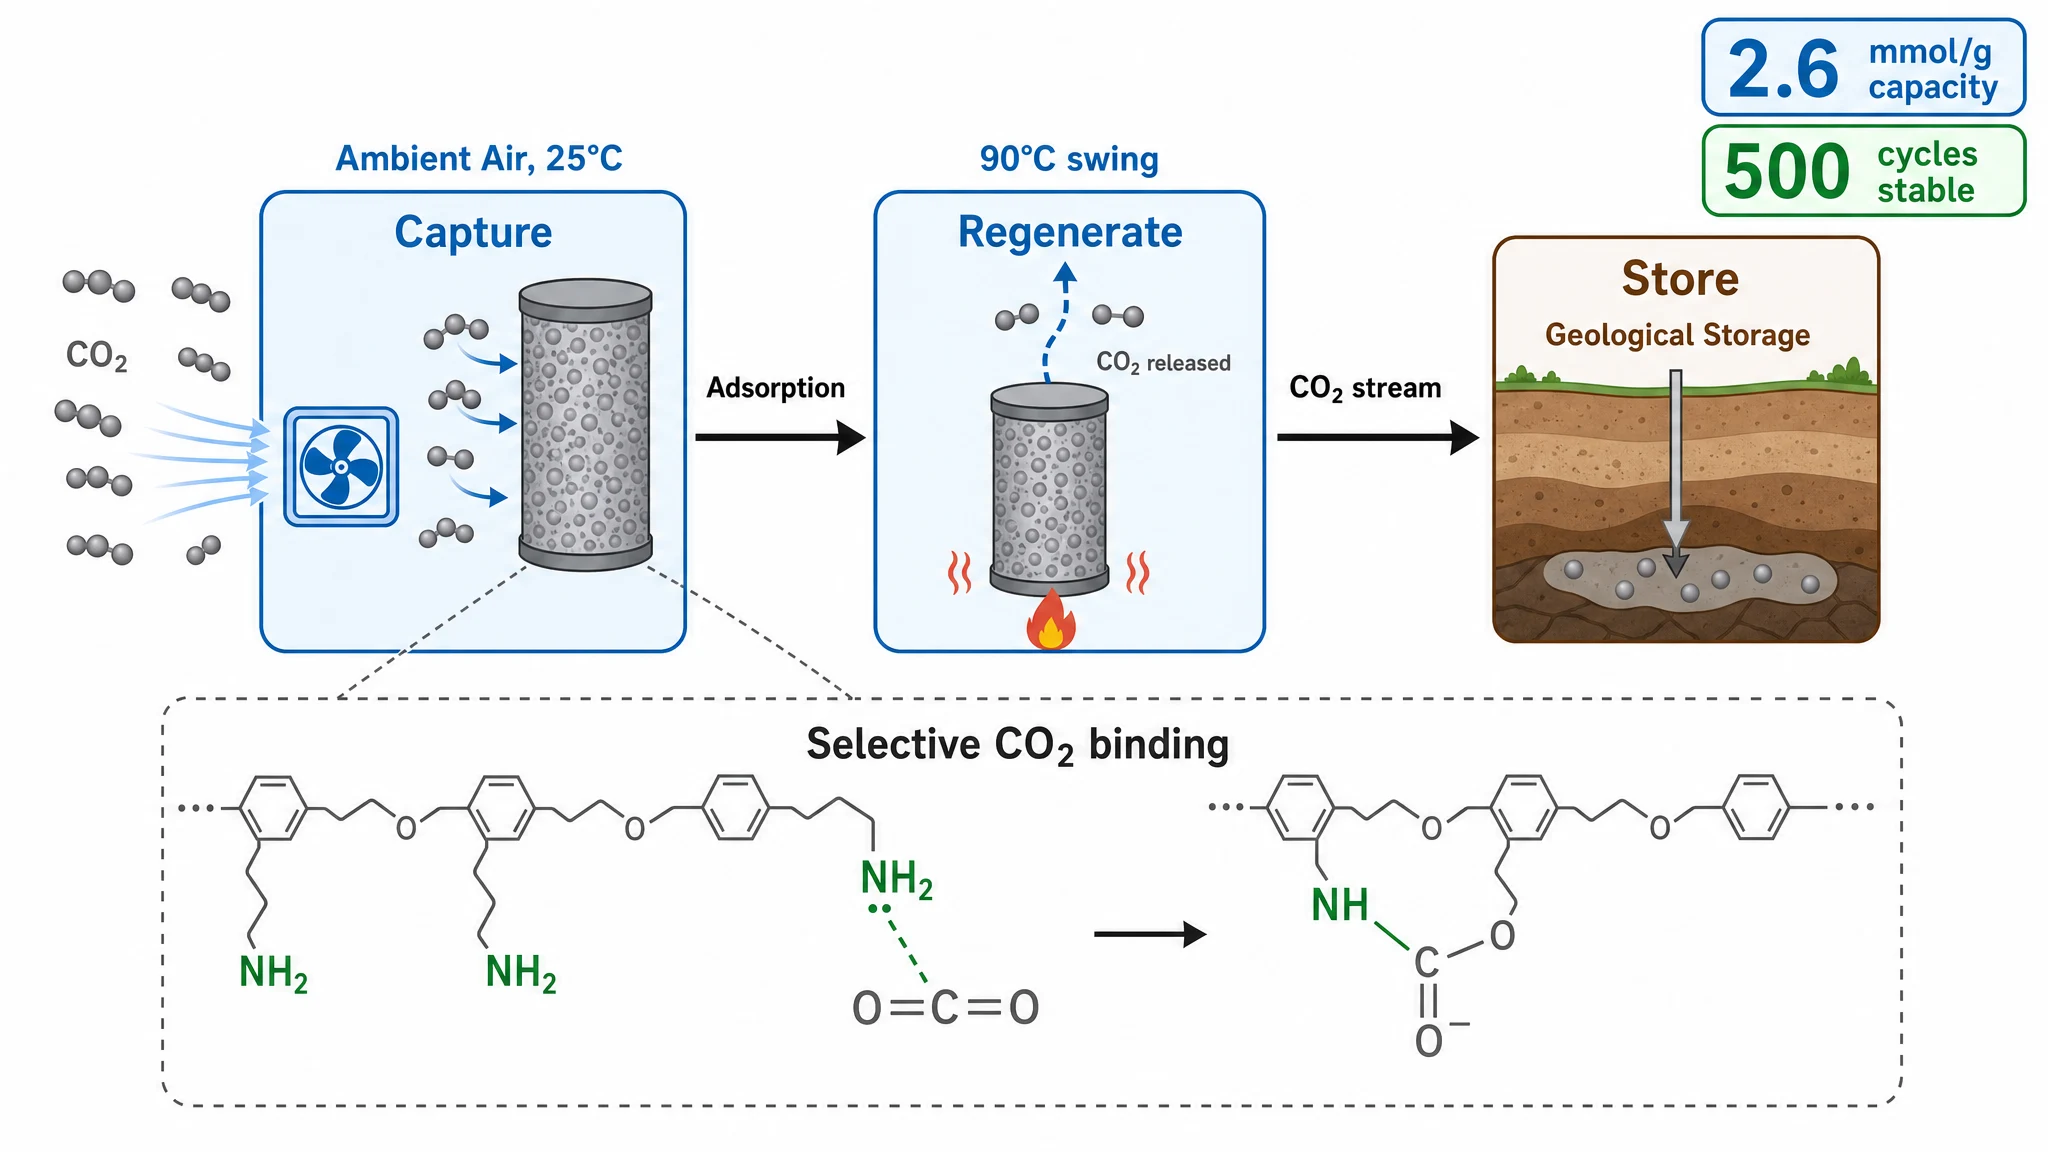
What is an AI scientific figure generator?
An AI scientific figure generator converts a written research idea or rough visual plan into a conceptual diagram draft. Instead of placing every shape and icon manually, you describe the scientific story and review a complete composition. Abfig is built around research summaries: it can organize entities, arrows, stages, and short labels into one visual explanation that you can regenerate or refine.
Conceptual figure, not primary evidence
This page is for explanatory diagrams. It does not turn raw datasets into validated plots, reconstruct microscopy, create diagnostic images, or prove a scientific result. Keep measured data and evidential imagery in the tools and workflows appropriate to those sources.
Start from text or a rough sketch
Use the input that matches how far you have already developed the visual idea. Both routes produce a new AI-generated image for author review.
Abstract or research summary
Paste 50–3000 characters describing the question, method, mechanism, and main finding. Keep only the relationships that need to appear in the diagram.
Rough sketch plus optional guidance
Upload a hand-drawn or digital layout when you already know the flow. Add short guidance for the subject, palette, labels, or direction; the result is a reinterpretation, not a pixel-perfect trace.
How to generate a scientific figure draft
Define one visual message
Choose the mechanism, sequence, comparison, or system the reader should understand. A focused input usually produces a clearer composition than a full manuscript.
Choose the canvas and direction
Select a square, landscape, or portrait shape, then add concise style hints such as a left-to-right flow, minimal labels, or a restrained palette.
Generate and inspect the draft
Check whether each entity, arrow, label, and relationship matches your source text. Regenerate the composition if the overall structure is wrong.
Refine regions and export
Use Refine for a new whole-image interpretation or Inpaint for a selected region. Export the reviewed result as RGB PNG or TIFF at the dimensions and resolution you choose.
Scientific figure use cases
The generator works best for ideas that need an explanatory visual structure rather than a statistically derived chart.
Biological and medical mechanisms
Draft interactions among cells, pathways, treatments, and outcomes as a conceptual mechanism for discussion and review.
Experimental and computational workflows
Arrange preparation, intervention, measurement, modeling, and analysis stages into a readable sequence.
Materials and engineering systems
Explain device layers, transport processes, energy flows, reaction pathways, or system components in one overview.
Research communication beyond submission
Create a visual draft for a preprint, lab meeting, research presentation, conference poster figure, or collaborator briefing.
Review the figure before sharing it
AI can accelerate composition, but it cannot take responsibility for the research. Use the output as a draft and apply the same scrutiny you would give any scientific illustration.
Verify every scientific relationship
Check terminology, anatomy, molecular structures, arrow direction, causal language, scale, and quantities against your source material.
Keep evidence in its original workflow
Do not replace measured charts, microscopy, scans, diagnostic images, or other primary evidence with an AI-generated conceptual image.
Check venue and disclosure rules
Publishers, funders, conferences, and institutions set different rules for AI-assisted images. Confirm the current policy and disclose use when required.
Related figure tools and guides
Graphical abstract maker
Open the generator to start from abstract text or a rough sketch.
Visual abstract guide
See how a one-image study summary is structured for clinical and research audiences.
Journal specifications
Check published dimensions and file guidance before preparing a journal figure.
DPI checker
Inspect pixel dimensions and effective print resolution after export.
Scientific figure generator FAQ
- What kinds of scientific figures can Abfig generate?
- Abfig is suited to conceptual diagrams such as mechanisms, experimental workflows, system overviews, and high-level research comparisons. It creates a visual draft from abstract text or a rough sketch.
- Can it generate charts from my dataset?
- No. Abfig does not calculate statistics or turn raw data into validated plots. Create data charts with an analysis or plotting tool, and use Abfig for a separate conceptual explanation when appropriate.
- Can I generate a scientific diagram from a sketch?
- Yes. Upload a rough sketch and optionally add text guidance. The model uses it to create a new visual interpretation, so you should expect to review and refine the result rather than receive an exact tracing.
- Can I edit objects after generation?
- You can regenerate the whole image and refine or inpaint selected regions. Abfig is not a vector or object-level editor, so individual shapes and text are not independently selectable layers.
- Which file formats can I export?
- Abfig exports RGB PNG and TIFF. You can choose output dimensions and resolution, including supported journal presets, then verify the exported file with the requirements of its destination.
- Can I submit an AI-generated scientific figure to a journal?
- Policies differ by publisher and journal. Some permit certain explanatory images with disclosure, while others restrict or prohibit generative AI artwork. Check the current policy before submission and never treat a conceptual image as research evidence.
Start with the scientific story
Paste a focused research summary or upload a rough sketch, generate a conceptual figure draft, and review every detail before you use it.
Create a Scientific Figure Draft