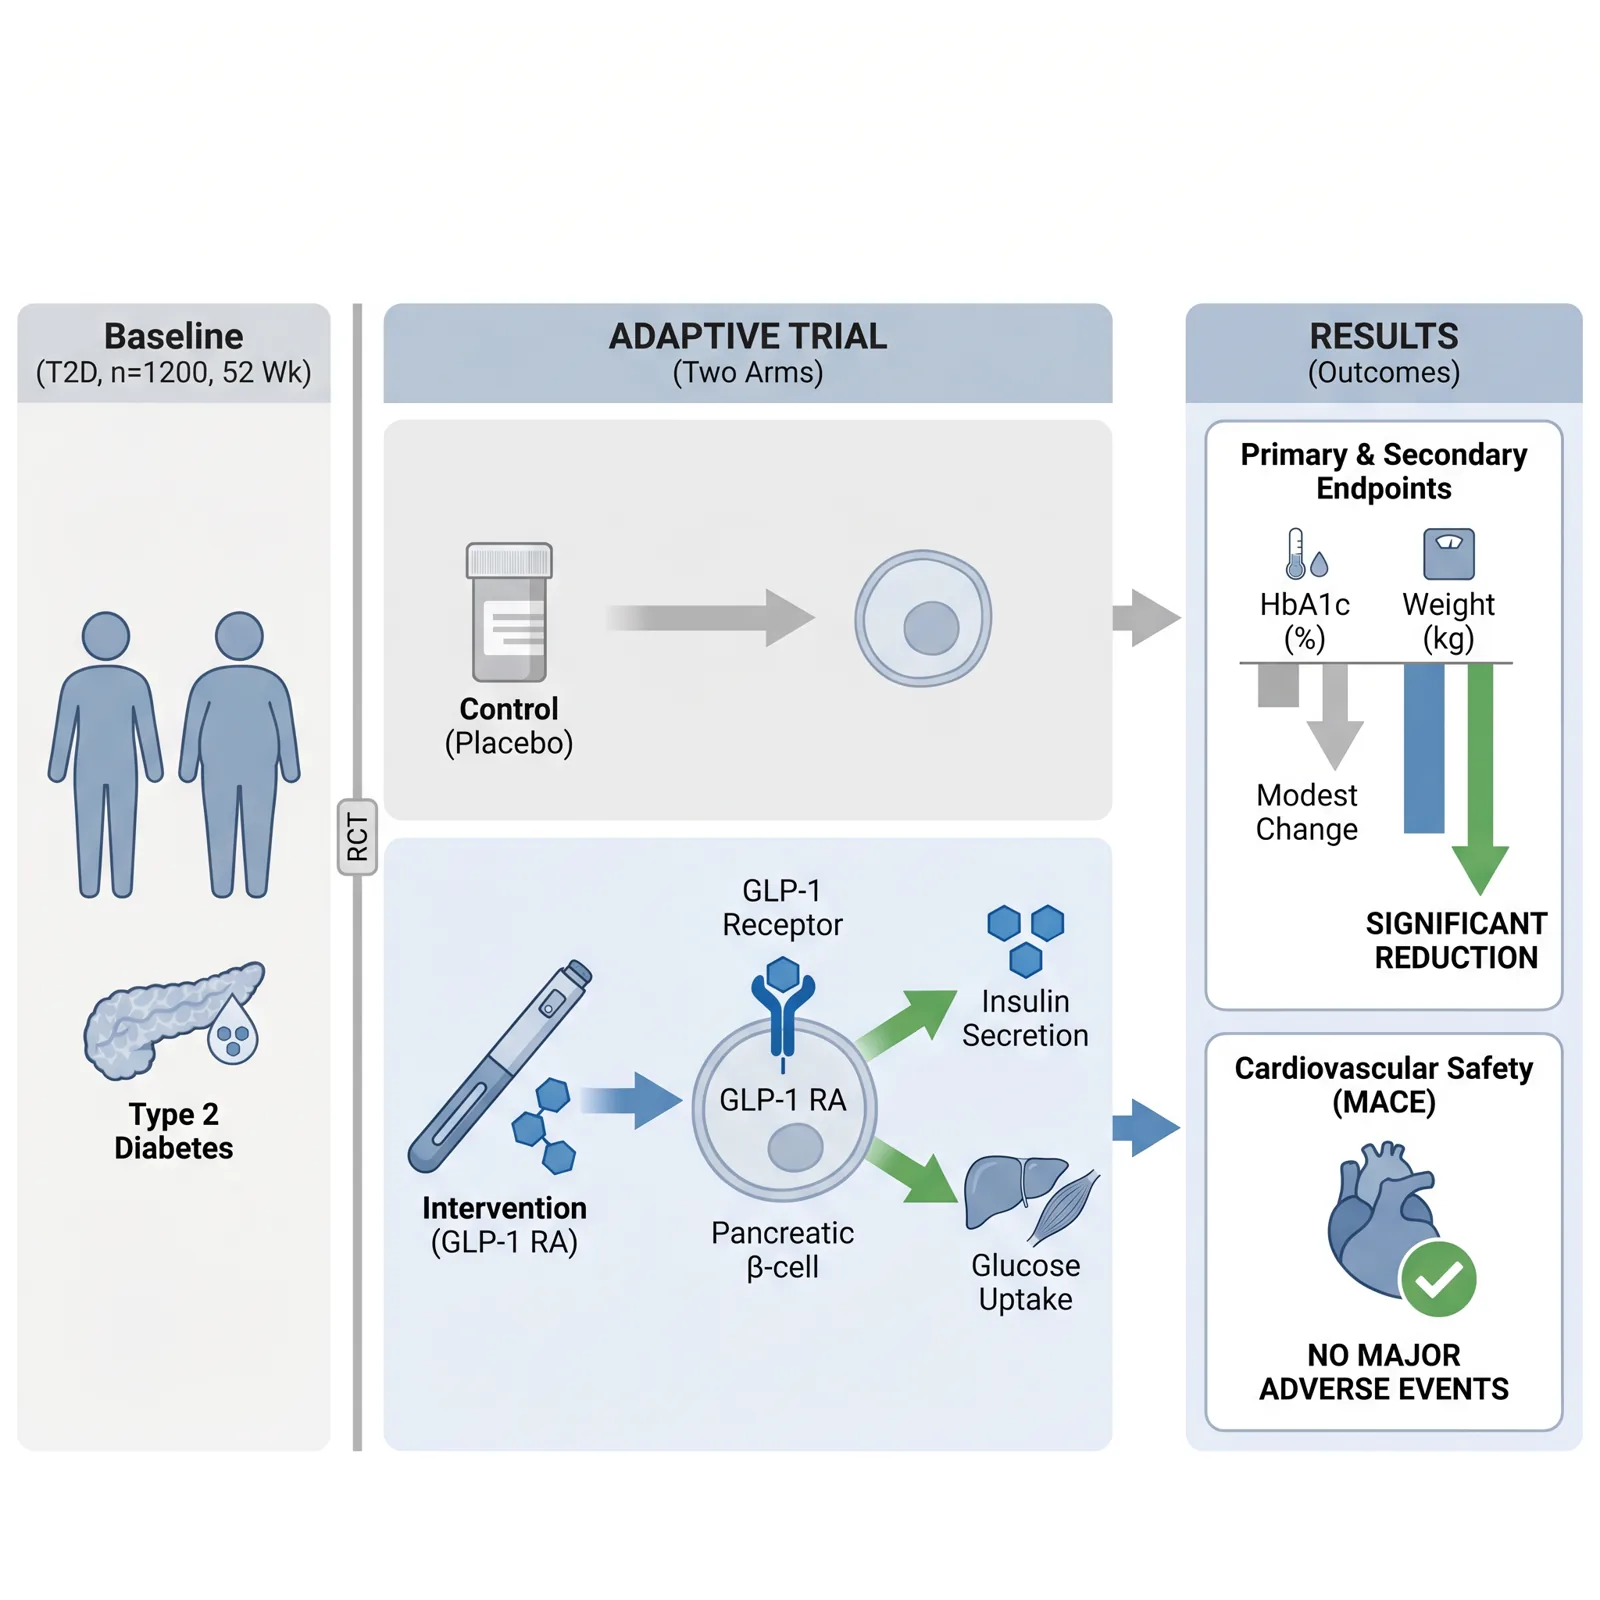
Visual Abstract vs Graphical Abstract: Check the Journal
“Visual abstract” and “graphical abstract” both describe visual research summaries, but they are not guaranteed to be interchangeable submission items. The exact journal decides the name, structure, production process, and upload requirements.
For example, JAMA Network visual abstracts summarize key findings and conclusions from randomized clinical trials, while Elsevier's graphical-abstract guide describes a concise pictorial summary used in search results, contents lists, and article pages.
Where the terms overlap
Both formats aim to help readers grasp a study's main message quickly. Both benefit from clear hierarchy, readable labels, and accurate representation of the results.
Where they can differ
- Structure: a clinical visual abstract may emphasize population, intervention or comparison, and outcome; another journal may request a single pictorial panel.
- Purpose: some are prepared for journal publication, while others are created by editorial teams or used primarily for dissemination.
- Technical rules: dimensions, file type, text density, and submission stage vary by journal.
Do not assume that a colleague's terminology or a template from another journal defines your required deliverable.
What to check
- Use the term in the exact journal's current instructions.
- Confirm whether authors submit the item or the journal creates it.
- Copy the requested structure, dimensions, file type, and resolution.
- Check image-production, rights, and disclosure rules.
Abfig can generate a raster draft from an abstract or sketch, but it does not decide which artifact a journal requests.
Review the journal policy first
Check the official journal guidance before using AI-generated imagery. If the policy is restrictive or unclear, do not submit an AI-generated figure.
Table of Contents
Author
Categories
Tags
More Posts
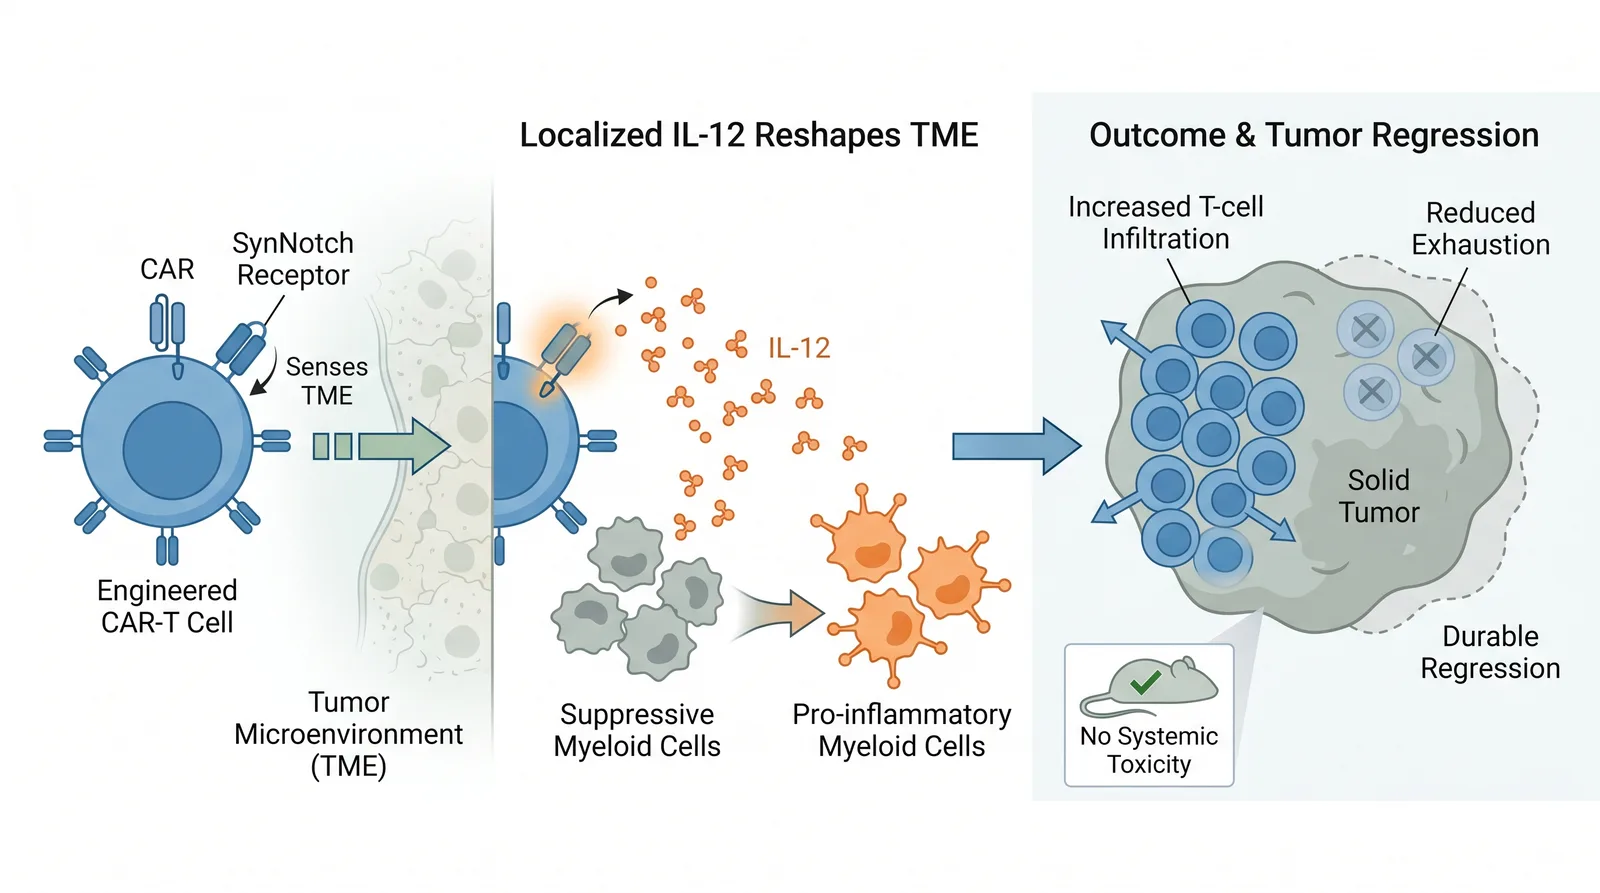
Graphical Abstract Examples: How to Analyze Layout and Hierarchy
Use illustrative Abfig drafts and official journal examples to study layout, hierarchy, labels, and visual flow.

Frontiers Graphical Abstract Guidance: Check the Journal First
The general Frontiers author guide does not define one standalone graphical abstract specification. Check the exact journal page and current figure rules.

Does PLOS ONE Require a Graphical Abstract? Current Guidance
PLOS ONE does not describe a separate graphical abstract submission. Learn what its optional Striking Image is and where to verify current figure rules.