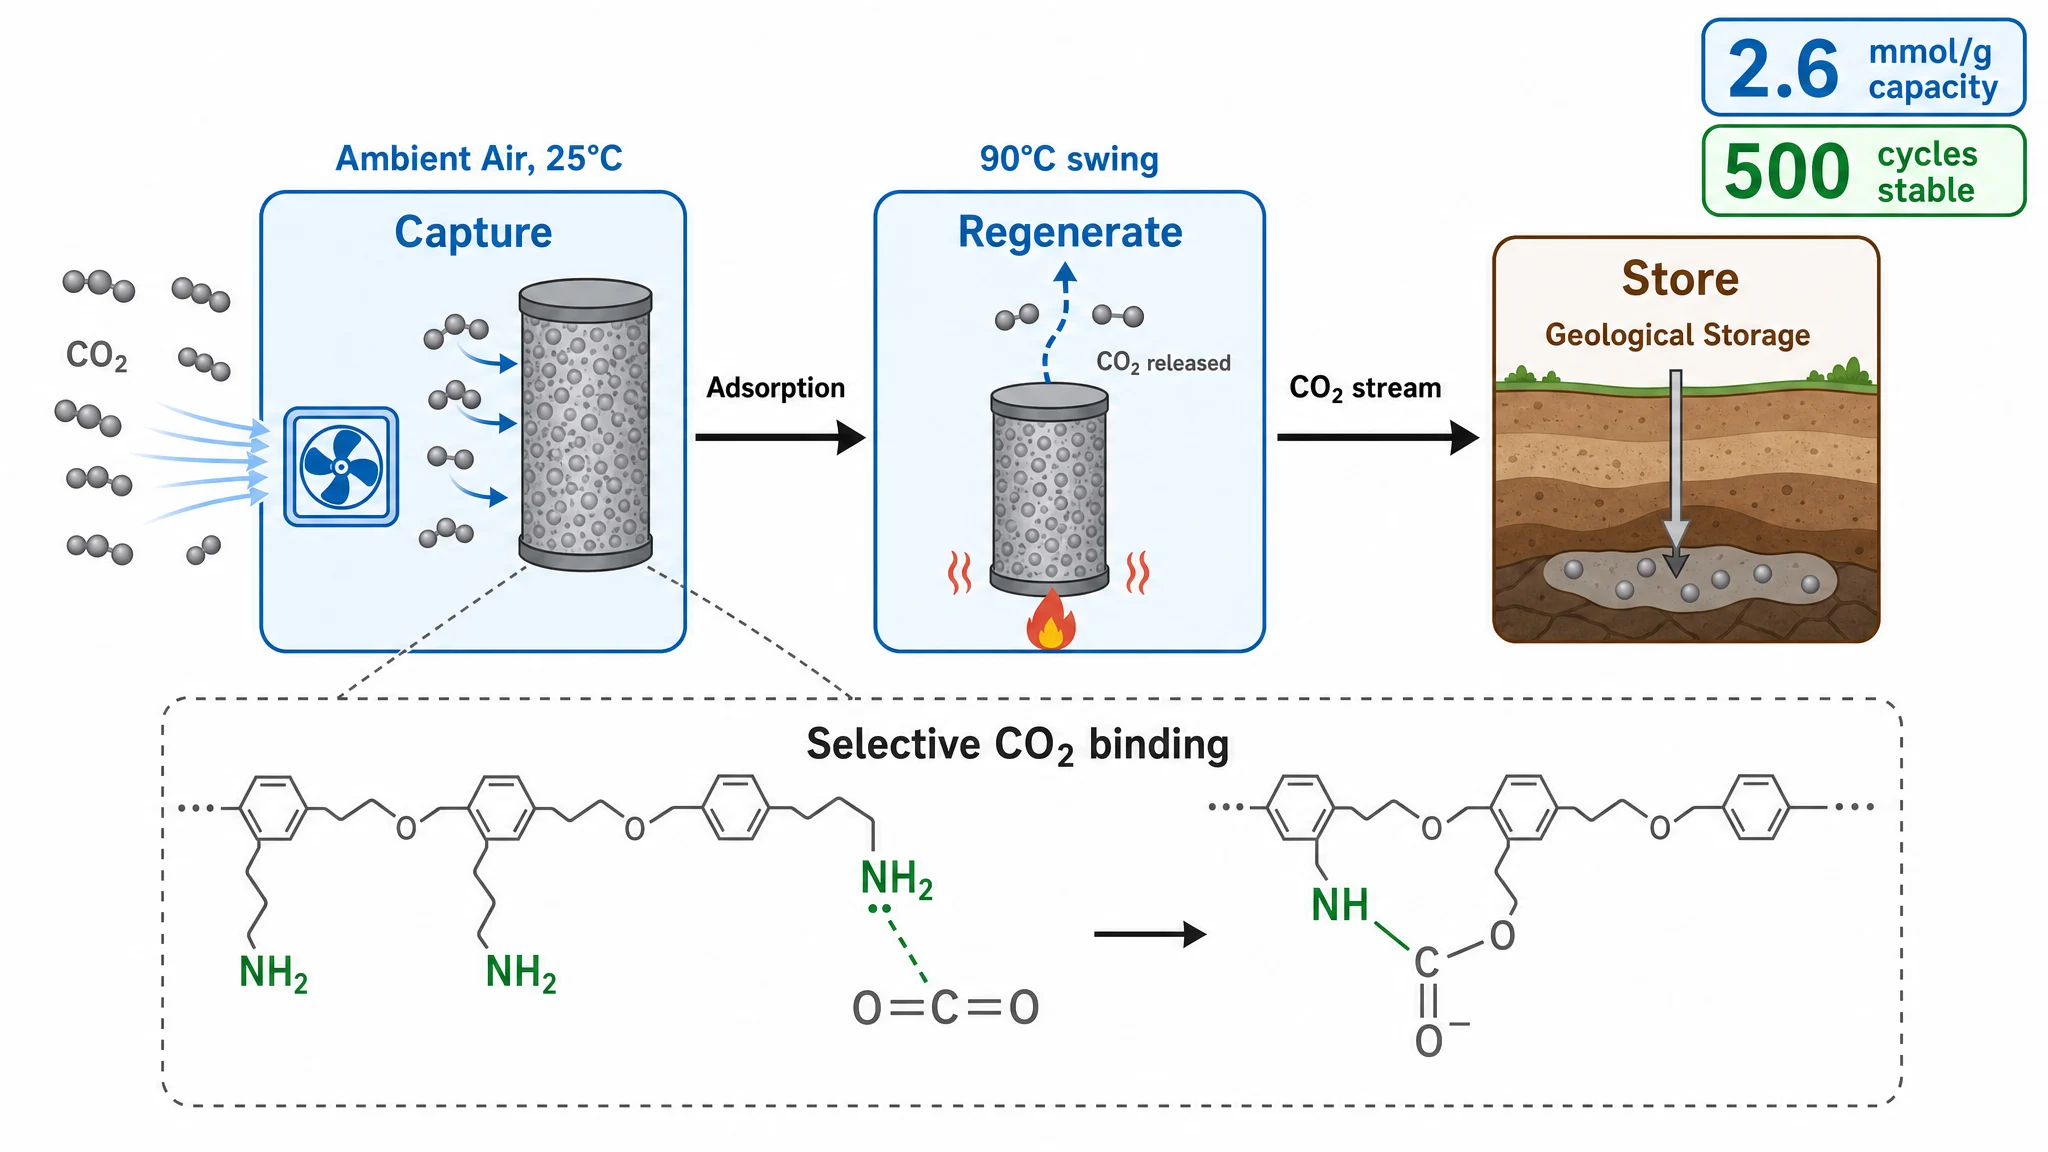
How to Make a Graphical Abstract in PowerPoint
PowerPoint can be used to build a graphical-abstract layout, but the exported file still needs to be checked against the exact journal instructions. Set the slide aspect ratio first, export a supported image format, and inspect the actual pixel dimensions instead of trusting a DPI label alone.
1. Set the slide size
Microsoft documents Design → Slide Size → Custom Slide Size for custom dimensions. Use the aspect ratio or physical dimensions named by the target journal, and confirm whether PowerPoint applies the size to every slide in the deck. See Microsoft's slide-size instructions.
2. Plan the reading order
Sketch a left-to-right, top-to-bottom, comparison, or central layout before adding detail. Keep one main result visually dominant.
3. Build with shapes, labels, and licensed assets
Use consistent arrows, containers, fonts, and colors. Check that every scientific relationship matches the manuscript and that you have permission to use external icons or images.
4. Export, then inspect the file
Microsoft's current export instructions list image options that vary by platform and version; on macOS the export dialog can accept explicit width and height. Microsoft also documents per-presentation image-quality settings rather than one universal “PowerPoint exports at 96 DPI” rule.
After export:
- inspect the pixel width and height;
- compare the aspect ratio and resolution with the exact journal guide;
- confirm the file type is accepted;
- inspect text and arrows at the final display size.
If the journal requires a format PowerPoint does not produce in the needed form, use an appropriate production tool and recheck the converted file.
A faster drafting route
Abfig can generate a complete raster draft from text or a sketch and offers journal-oriented canvas settings and custom dimensions. It exports RGB PNG or TIFF. Those settings reduce manual setup, but they do not replace the current journal instructions.
Review the journal policy first
Check the official journal guidance before using AI-generated imagery. If the policy is restrictive or unclear, do not submit an AI-generated figure.
Table of Contents
Author
Categories
Tags
More Posts
Elsevier Graphical Abstract Guidelines: Size, Format & Workflow
Elsevier recommends a minimum 1328 × 531 px graphical abstract at 300 dpi. Check the current preferred formats and your journal-specific instructions.

Wiley Graphical Abstract Guidelines: Check the Exact Journal
Wiley requirements vary by journal. Compare two current Angewandte Chemie sources that disagree on the wide size, then recheck the live title.
Graphical Abstract Size & DPI Requirements by Journal
Graphical-abstract size, resolution, color, and file rules are journal-specific. Compare cited examples, then verify the exact journal.