Sketch to Graphical Abstract with AI: Generate, Refine, and Inpaint
A rough sketch is often the fastest way to communicate scientific structure to an image model. It fixes the approximate positions and reading order before style enters the conversation.
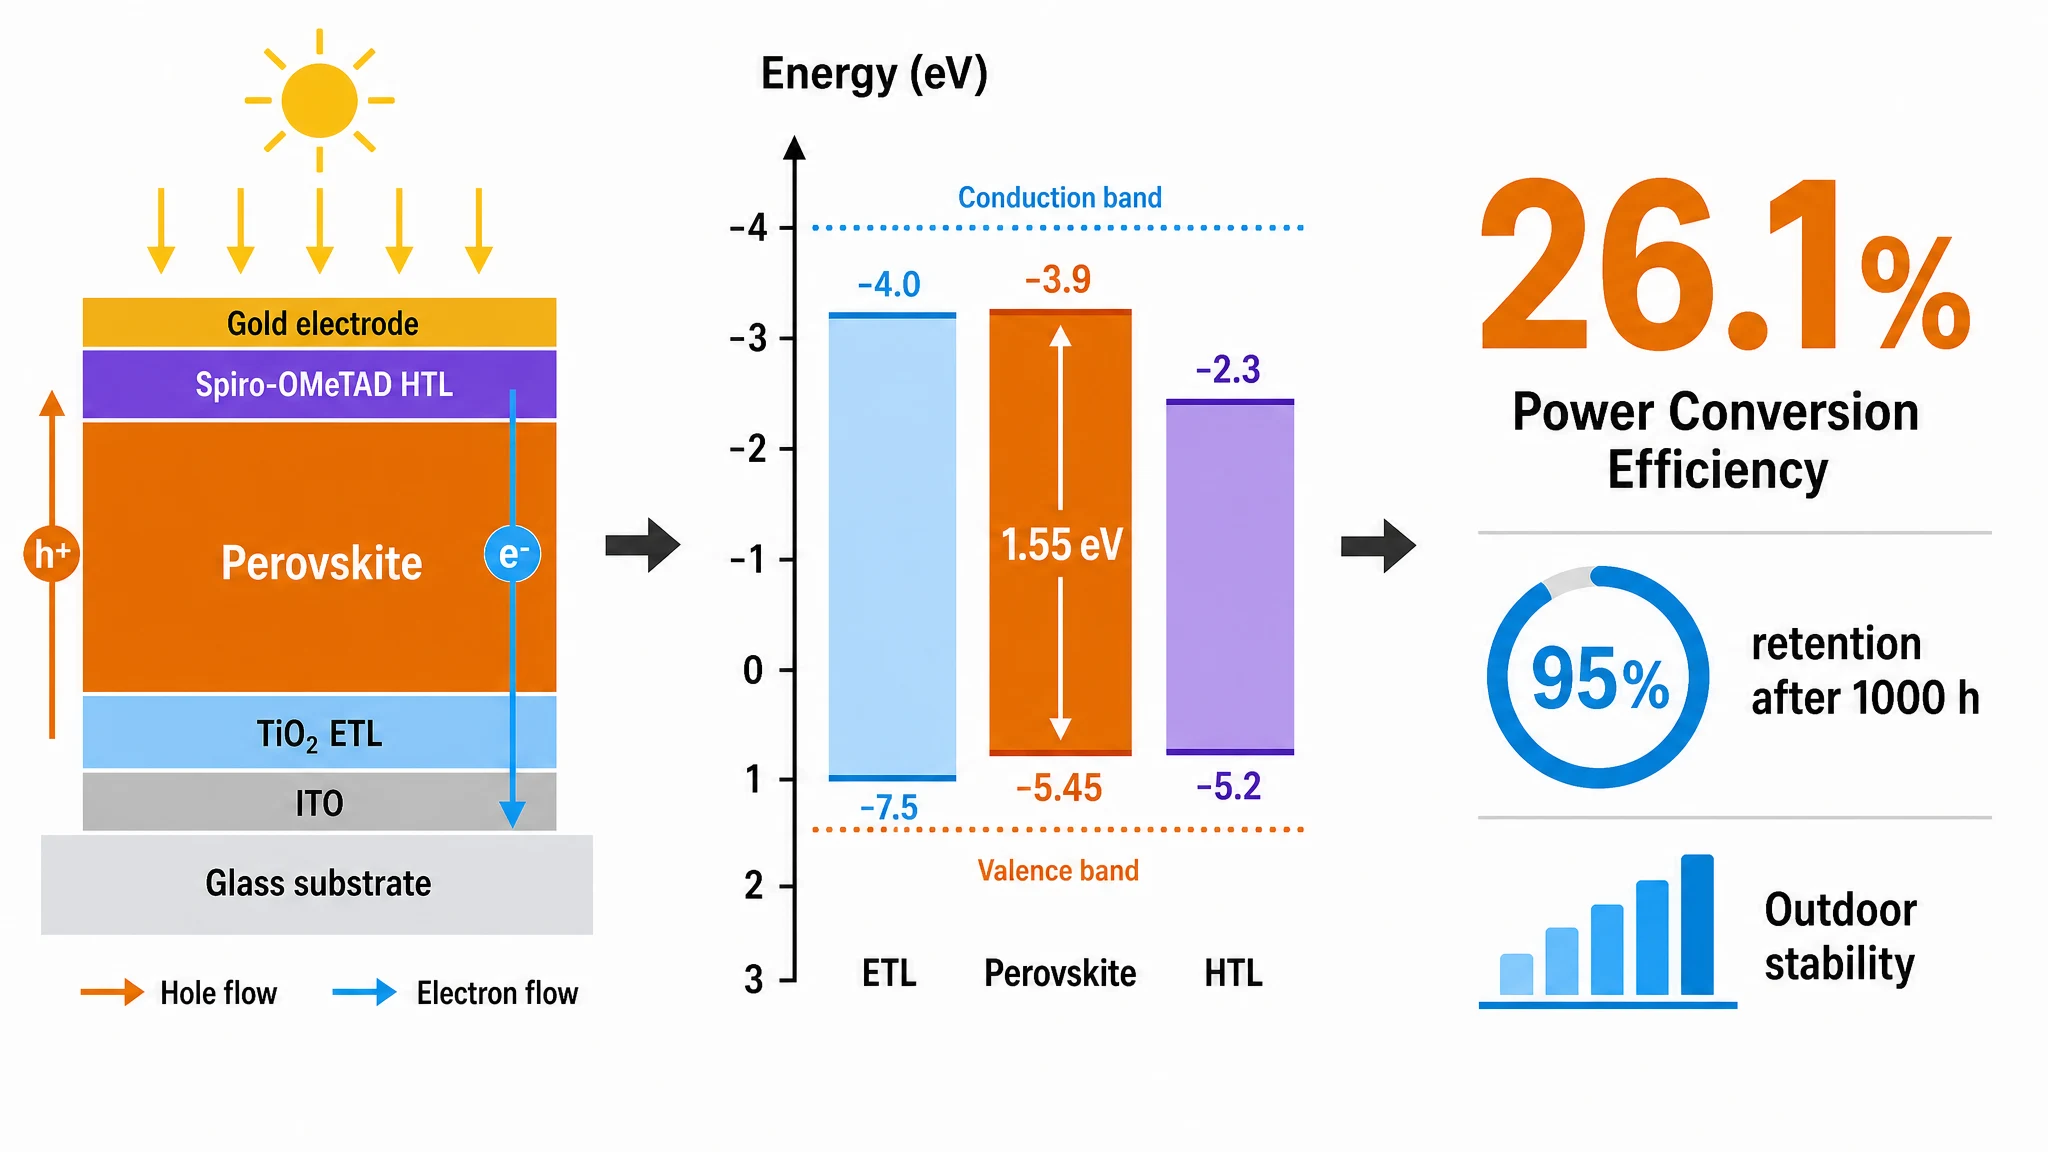
The pair below comes from Abfig's existing product workflow. It is shown as an illustrative draft, not as a published figure or evidence of journal acceptance.
Start with structure, not decoration
The sketch establishes the main subject, the surrounding processes, and the direction of the story. It does not need polished icons or exact typography.
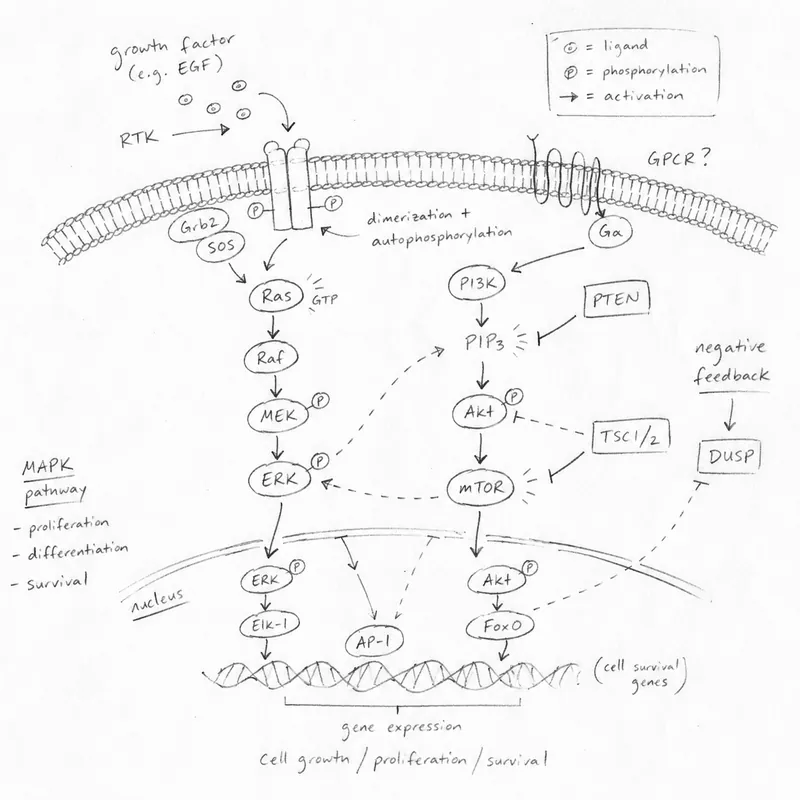
Before uploading, check that the sketch has:
- one main message;
- an obvious reading order;
- labels for relationships that the model should not guess;
- enough empty space for the important elements.
Generate the first draft
Upload the sketch, then describe the scientific subject and visual treatment in plain language. Mention relationships and labels explicitly. Generation redraws the image as a complete raster composition; it does not convert the sketch into editable vector objects.
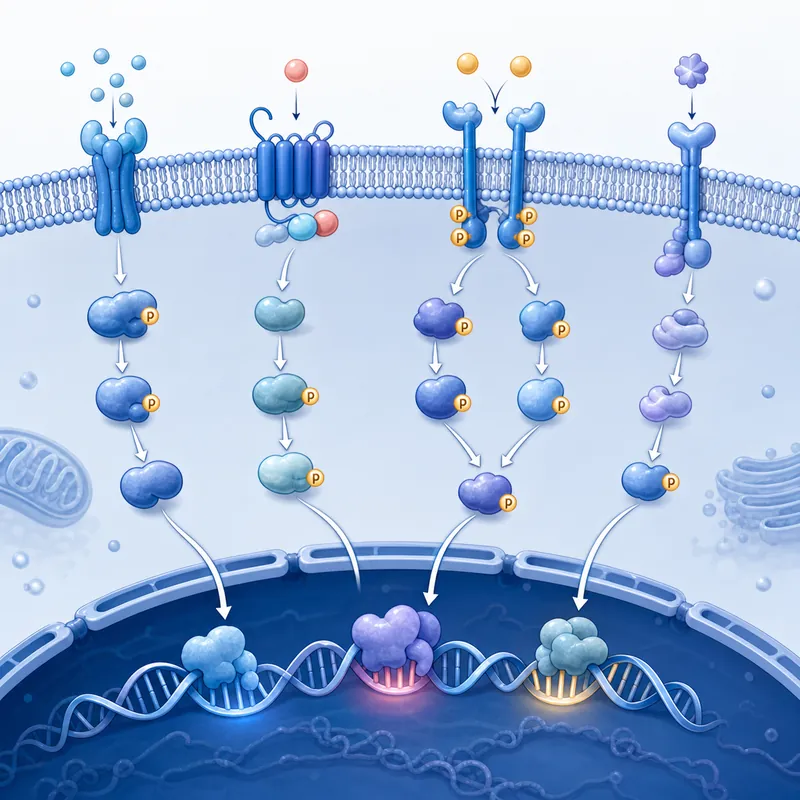
Compare the result with the sketch rather than judging appearance alone. Verify that arrows point in the right direction, labels refer to the right object, and no visual detail implies a result that is not in the research.
Choose the right correction path
Use Refine when the whole draft needs a new composition, a clearer hierarchy, or a different visual style. Refine redraws the complete image, so details outside the problem area may also change.
Use Inpaint when the composition is already useful and one bounded area needs correction. Brush over that area, describe the intended replacement, and inspect the transition around the mask.
Inpaint is useful for local redraws, but it is still generative. Re-check the changed area and its scientific context after every result.
What the workflow can and cannot do
Abfig can generate a visual draft from your input, redraw the full image, and redraw a brushed region. It does not provide Illustrator-style layers or guarantee that a generated label, molecule, or mechanism is scientifically correct.
The researcher remains responsible for factual review, journal-policy review, and the final submission file.
Review the journal policy first
Check the official journal guidance before using AI-generated imagery. If the policy is restrictive or unclear, do not submit an AI-generated figure.
Table of Contents
Author
Categories
Tags
More Posts
Wiley Graphical Abstract Guidelines: Check the Exact Journal
Wiley requirements vary by journal. Compare two current Angewandte Chemie sources that disagree on the wide size, then recheck the live title.
Why Was Your Graphical Abstract Returned? 7 Checks
Check journal-specific dimensions, resolution, legibility, format, density, permissions, and scientific focus before resubmitting.
Frontiers Graphical Abstract Guidance: Check the Journal First
The general Frontiers author guide does not define one standalone graphical abstract specification. Check the exact journal page and current figure rules.