An experimental workflow diagram from a protocol, with a worked example
An experimental workflow diagram should let a reader follow what happened to a sample, in what order, and where groups split or rejoin. Start with a sequence of actions, not a paragraph copied unchanged from the methods section.
This example uses a fictional cell experiment, without measured results or real research data. The image is an actual Abfig output. It contains a model mistake worth checking before you use a similar draft.
1. Reduce the protocol to a sequence
Our sequence is: prepare cells, split into control and treatment groups, incubate, measure fluorescence, then compare the measurements. Each box describes an action. The comparison is a planned analysis, not a claim that one treatment worked better.
Before opening the scientific flowchart maker, write a table:
| Stage | Input | Action or output |
|---|---|---|
| Preparation | Cells | Prepared cells |
| Allocation | Prepared cells | Control and treatment groups |
| Incubation | Both groups | Incubated samples |
| Measurement | Both groups | Fluorescence measurements |
| Comparison | Both measurement sets | Comparison stage |
If only one branch receives a measurement, say so. If groups never rejoin, do not ask the diagram to merge them.
2. Describe branches explicitly
Our brief requested five labeled stages, separate Control and Treatment branches, and a join at Compare. It requested short English labels and no invented sample sizes, numerical results, charts or conclusions. The complete input is available with the example on the tool page.
Use a similar structure with your own methods. Name every branch, state its destination and identify conditions that change the next step. Keep counts in your source notes so you can compare them with the output. Do not ask an image generator to infer missing counts.
3. Inspect the actual draft
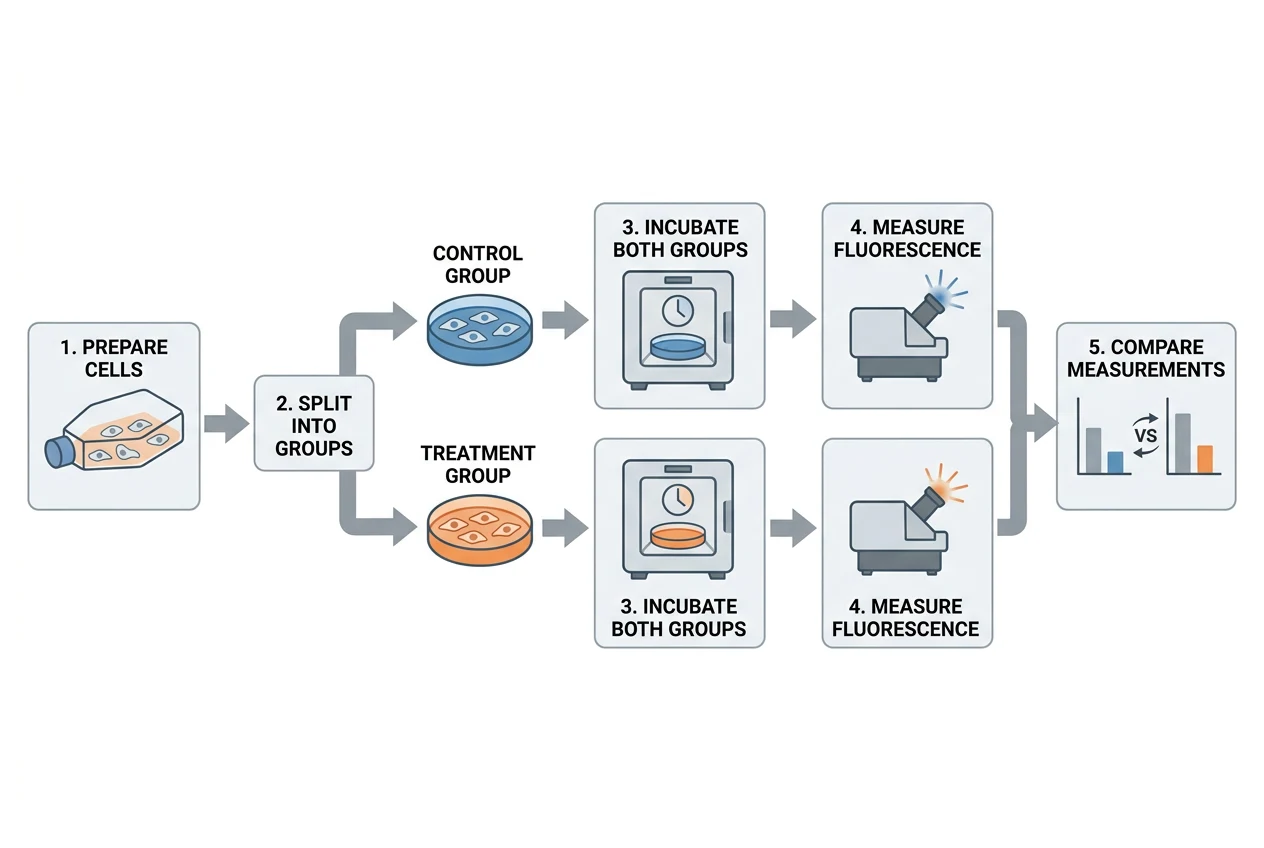
The result contains the five stages in order, separate group labels and a final join. It also adds a bar-chart icon inside the comparison stage, despite the instruction not to draw charts. These bars contain no measured data. They must not be presented as results. Remove or replace the icon if it could imply a treatment effect.
Visual inspection matters even when the overall arrangement looks convincing. Trace each branch from its starting sample to its final readout, then check the labels individually.
4. Revise at the right level
If the sequence is wrong, simplify the brief and regenerate. Selected-area editing may help remove a localized object. Refine redraws the whole image, so other labels and arrows can change too. Check the complete figure after an edit.
If you already have a layout, the sketch-to-diagram workflow can use it as a reference. The result remains a reinterpretation, not an exact tracing or editable vector boxes.
5. Export and inspect the saved file
Abfig exports RGB PNG and TIFF under the applicable paid-access rules. Open the saved file at its intended size and inspect labels and arrowheads. Use the DPI checker for dimensions and resolution; changing DPI metadata cannot repair a mislabeled branch.
For a study-wide summary combining a question, method and finding, use the graphical abstract maker. For a sequence of experimental actions, keep the workflow diagram focused on that sequence. Neither replaces your methods or source data.
Review the journal policy first
Check the official journal guidance before using AI-generated imagery. If the policy is restrictive or unclear, do not submit an AI-generated figure.
Table of Contents
Author
Categories
Tags
More Posts
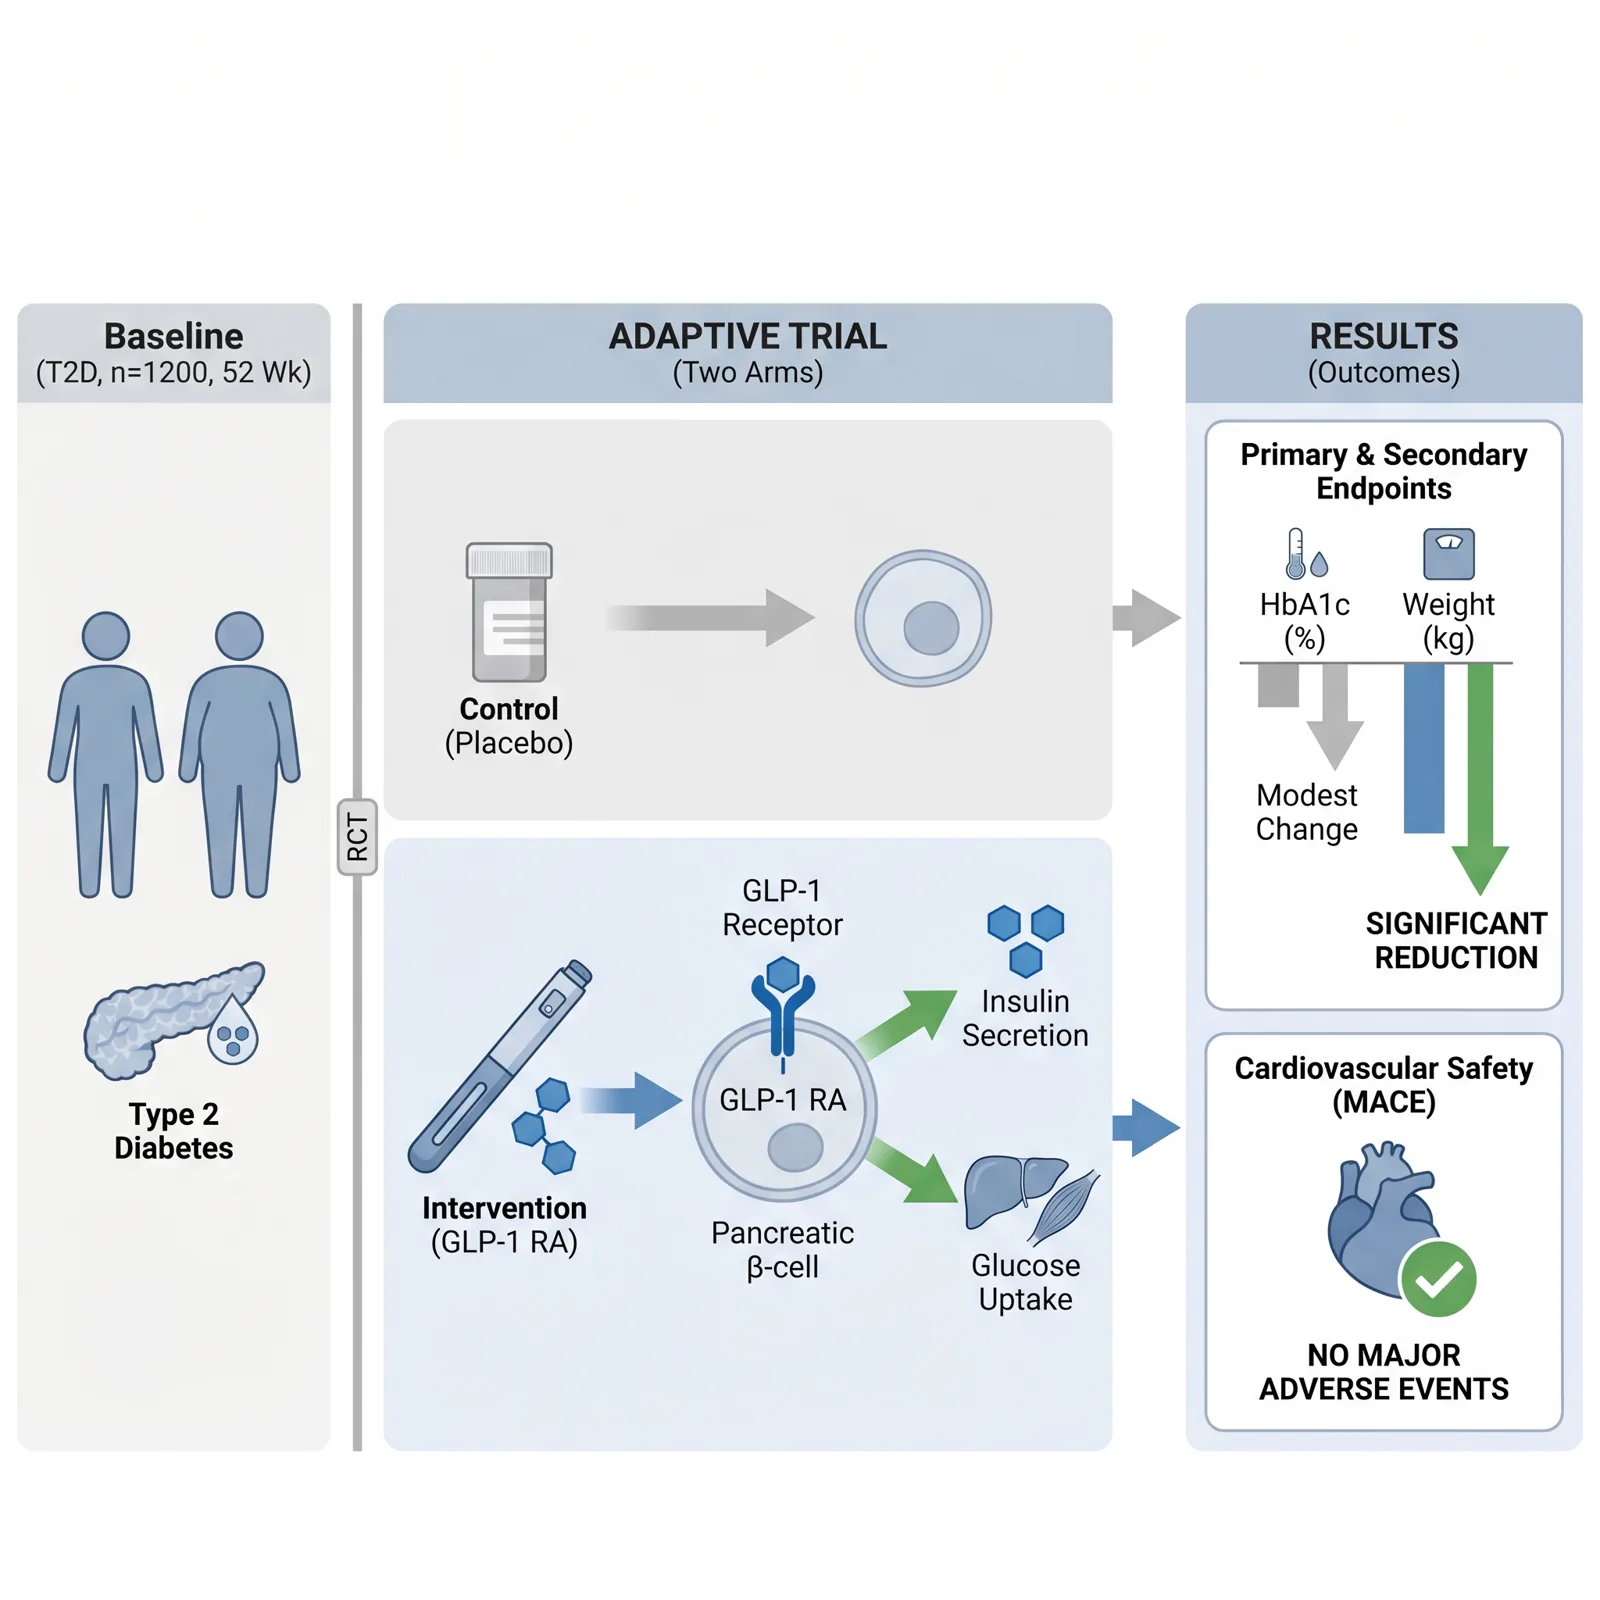
Visual Abstract vs Graphical Abstract: Check the Journal
Visual abstract and graphical abstract overlap, but they are not guaranteed to be the same deliverable. Follow the exact journal definition.
Why Was Your Graphical Abstract Returned? 7 Checks
Check journal-specific dimensions, resolution, legibility, format, density, permissions, and scientific focus before resubmitting.
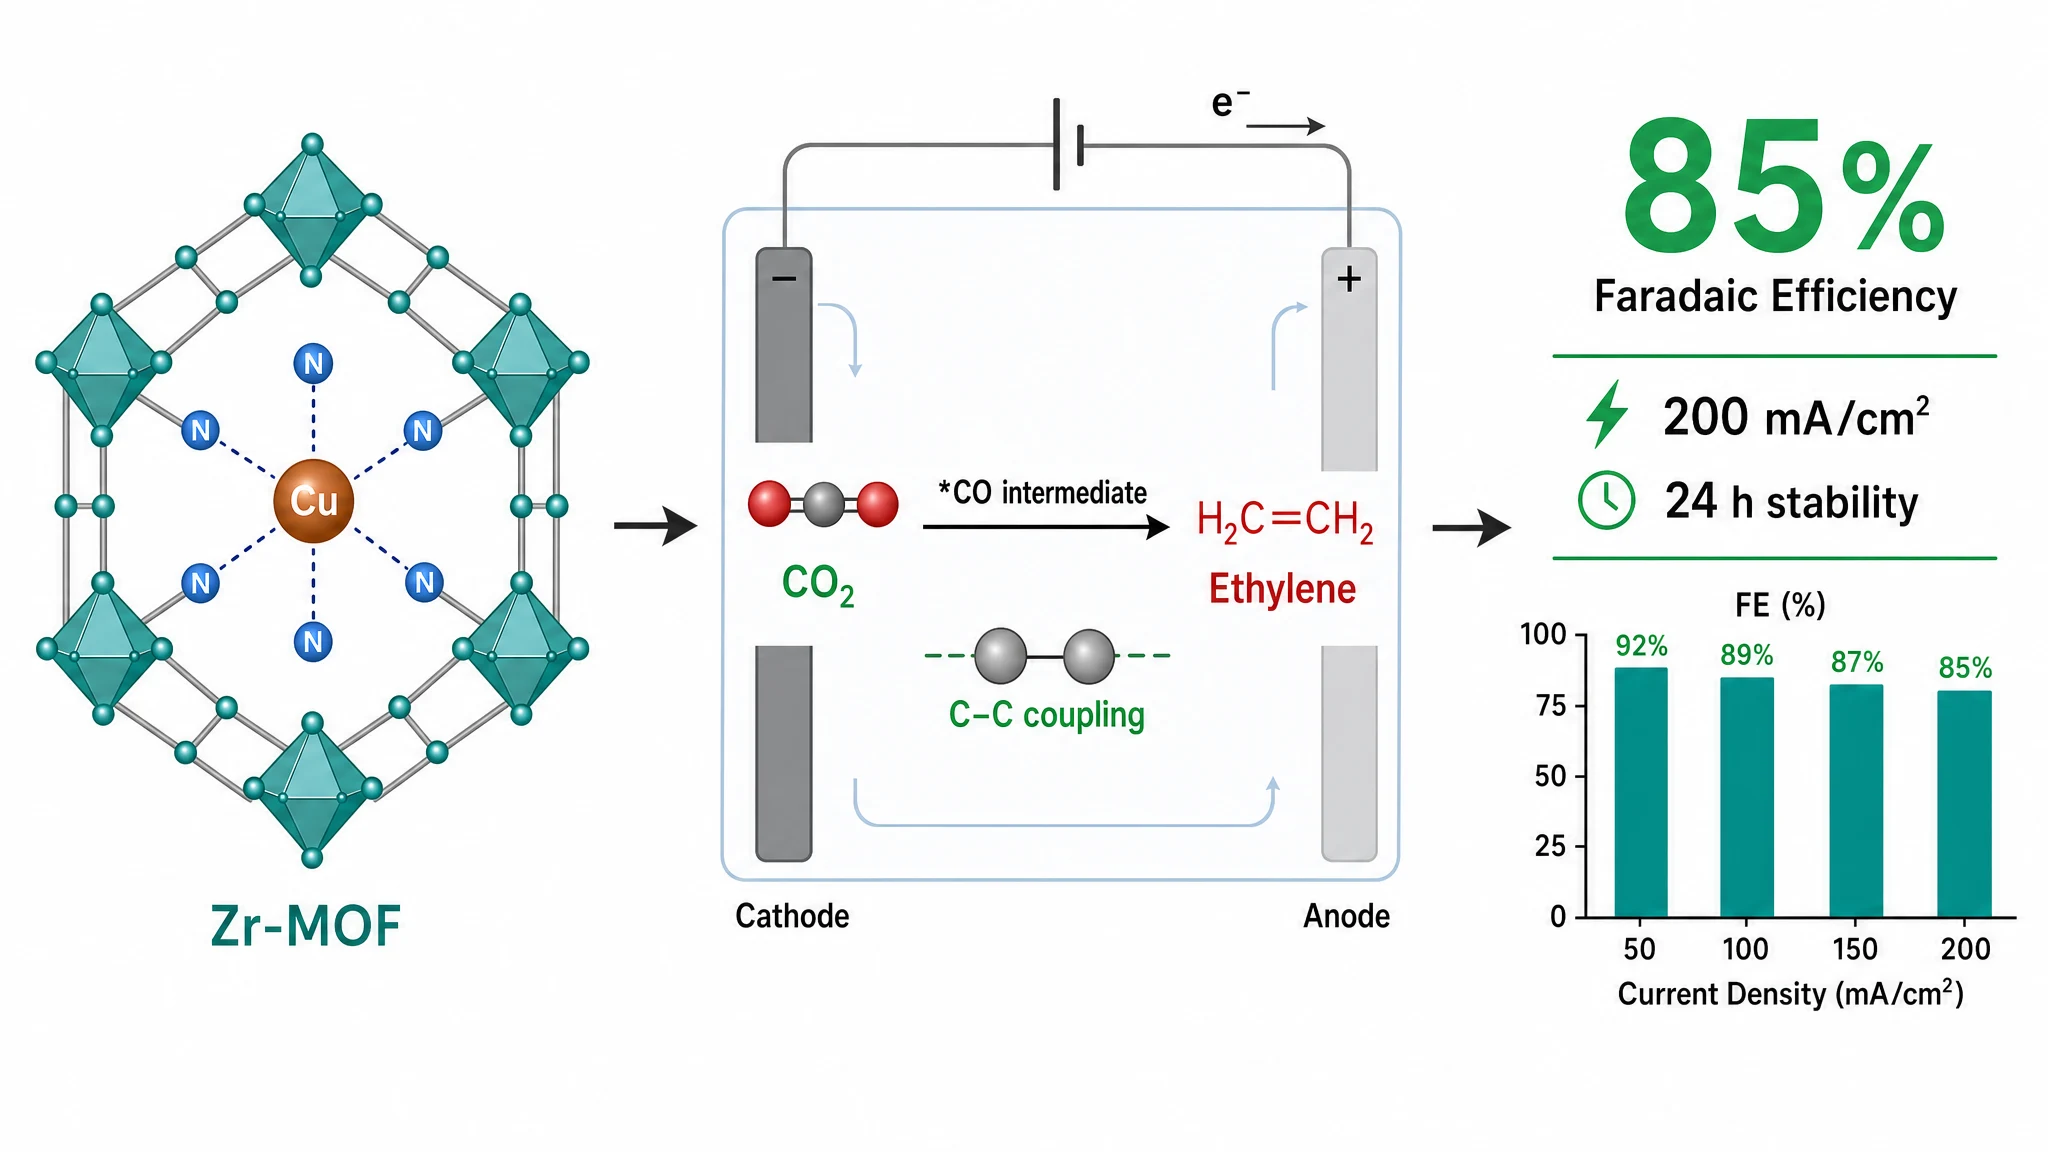
Graphical Abstract Size & DPI Requirements by Journal
Graphical-abstract size, resolution, color, and file rules are journal-specific. Compare cited examples, then verify the exact journal.