Scientific flowchart maker
Turn experimental steps into a research workflow diagram. Describe the order, branches and readouts below, then inspect a visual draft before sharing it.
01 / Your starting point
What’s the story?
0 / 3000
Output optionsGeneral (choose ratio) · Auto · Single · 1K · Web preview
Up to 1 free generation trial per browser, with no daily refill. Sign in to save your result; downloading new artwork requires paid access.
Paid access unlocks watermark-free downloads for retained originals and journal-sized exports.
02 / Your visual draft
Sample image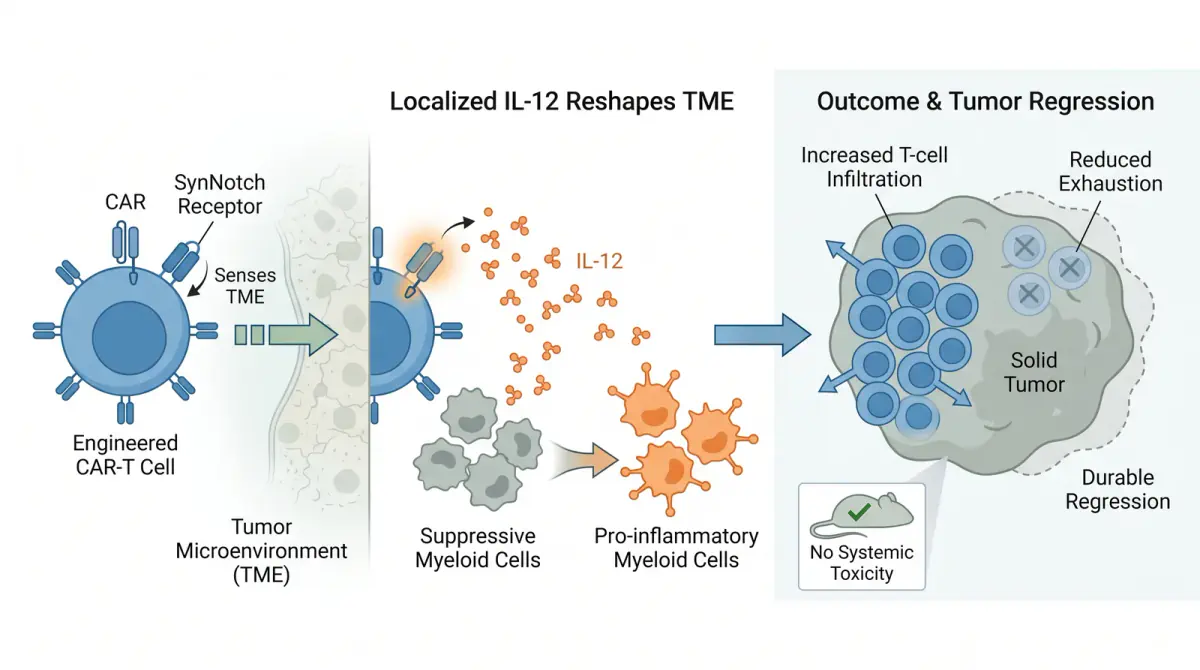
See the kind of story you can build
Your generated figure will replace this example while your abstract and output choices stay in place.
Review every scientific relationship and label, then check your target journal’s current AI-image policy.
An example to inspect and adapt
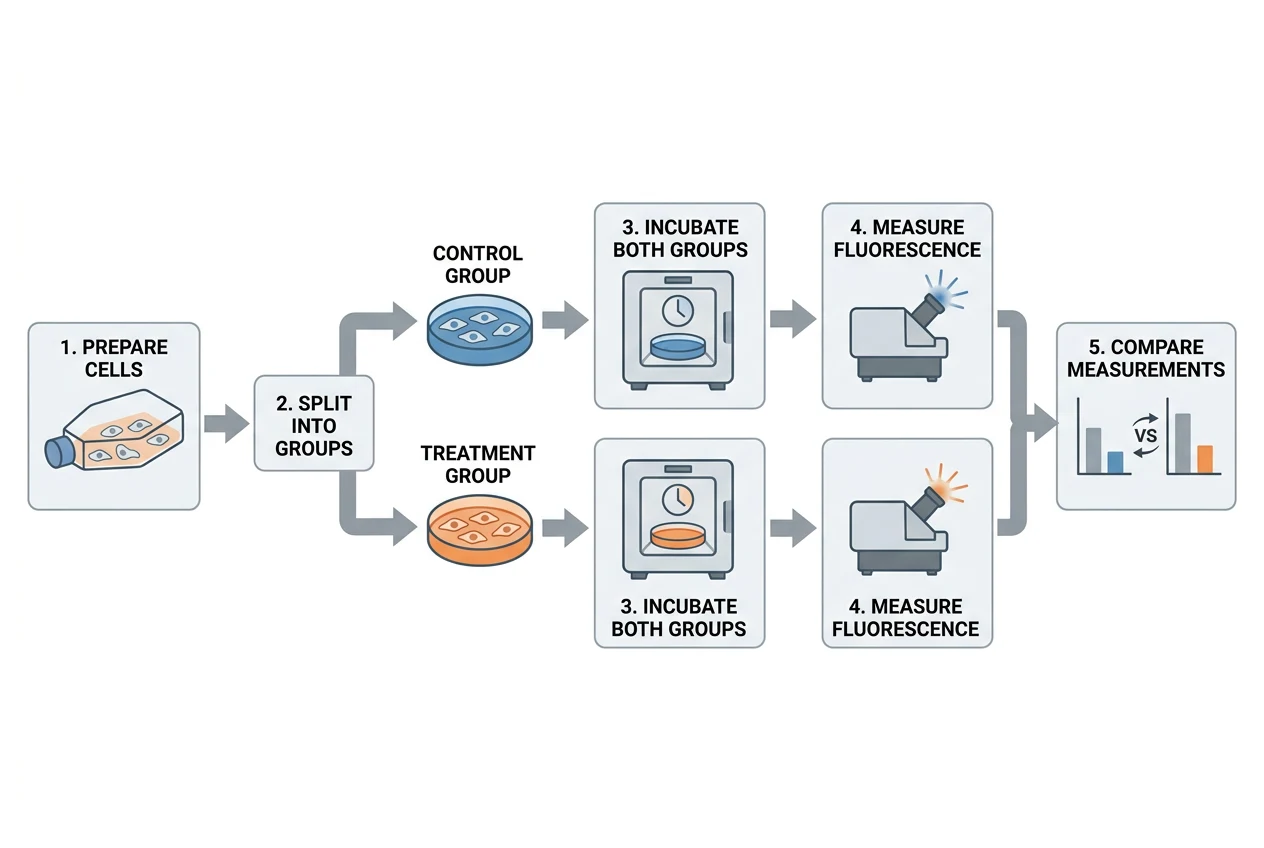
Review of this result: the five stages, two branches and final join are present. The model also added a chart icon despite the instruction not to draw charts. It contains no measured data; remove it if it could imply a result.
Describe the diagram
Draw a scientific flowchart for a fictional cell experiment. Use five labeled stages: 1. Prepare cells. 2. Split into two groups. Branch into Control and Treatment. 3. Incubate both groups. 4. Measure fluorescence in both groups. 5. Compare the measurements. Show arrows in that order and make the two groups rejoin at Compare. Keep the group labels separate. Do not invent sample sizes, numerical results, charts or conclusions. Use a clear left-to-right workflow with short English labels.
What to include in your brief
Write the experimental steps
Start with the material or sample, then list preparation, intervention, measurement and analysis. An experimental workflow diagram explains the procedure; it should not invent results.
Name every branch
Say which step splits into control and treatment groups, what differs between groups, and where the paths rejoin. Include real counts only when you can verify them.
Choose one level of detail
A study design overview needs fewer stages than a lab protocol. Use short labels, specify a reading direction and keep the first draft focused on one process.
Check the draft before using it
- Trace every arrow from input to readout. Check that stages are in the correct order and that no required step has disappeared.
- Check branch labels and joins. A visually attractive research flowchart can still connect the wrong groups.
- Review the image at its final size. PNG and TIFF are raster images; increasing DPI cannot repair misspelled labels or create missing detail.
Choose a diagram for your research task
Continue working on your figure
Questions about this tool
- Can I create an experimental design diagram?
- Yes, describe the study groups, interventions, sequence and readouts. Abfig drafts an illustration from that brief. It does not design your experiment or validate its methodology.
- Is this a PRISMA or CONSORT flow diagram tool?
- This is a general scientific workflow drafting tool. It does not enforce PRISMA or CONSORT templates or reconcile participant counts. Use the relevant official reporting template for those tasks.
- Can I move individual boxes and arrows?
- Abfig produces a raster draft. Refine redraws the image from an instruction, and selected-area editing can change a region. There is no object-level flowchart editor or native SVG export. Verify the result after each edit.