Experimental Design vs Workflow Diagram: What to Show
An experimental design diagram and an experimental workflow diagram can describe the same study while answering different questions. Design emphasizes the planned comparison and the relationship between groups, interventions and measurements. Workflow emphasizes what happens to a sample and in what order.
The terms overlap in everyday use. Do not choose a new tool just because a page calls one a “research flowchart,” “study design schematic” or “experimental workflow.” First decide what the reader must understand.
Start with the question the reader needs answered
| Reader’s question | Useful emphasis | Details to preserve |
|---|---|---|
| What is being compared? | Design | Groups, reference condition, intervention and readout |
| What happens first, then next? | Workflow | Inputs, actions, branches, timing and outputs |
| What did the study find? | Study summary or graphical abstract | The supported finding, with its context and limits |
A diagram is a representation of a plan or study, not a statistical or methodological validation. For formal design questions, use appropriate methodological expertise. NC3Rs EDA examples show how particular design features can be represented; they also warn that an example from the same research field may not fit another experiment.
One fictional cell experiment, two views
Suppose the author’s notes say: prepare cells, allocate them to Control and Treatment, incubate both groups, measure fluorescence, then compare measurements. No sample size, treatment effect or measurement values are supplied.
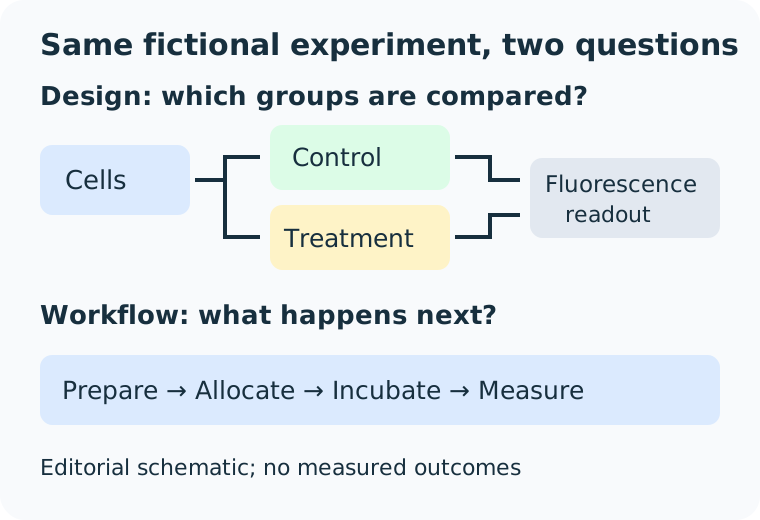
This editor-authored schematic is not an Abfig model output or experimental evidence. It deliberately omits values and conclusions. It is also not a complete experimental plan: allocation method, experimental unit, replication and other design decisions have not been supplied.
For the design view, keep both groups visually connected to the intended readout. Do not make the treatment look more successful using taller bars, larger cells or brighter outcomes. For the workflow view, preserve action order and show where the sample branches. A planned comparison is not a result.
Write the brief for the view you need
A design-oriented brief for this illustration might say:
Show a fictional planned comparison of Control and Treatment cells. Both groups lead to a fluorescence readout. Keep the groups equally prominent. No measured outcomes, sample sizes or statistical charts. Label the comparison as planned.
A workflow brief might say:
Show preparation, allocation into Control and Treatment, incubation, fluorescence measurement and comparison in that order. Preserve the two branches. Do not invent counts, charts or conclusions.
These are editorial input examples, not new tested model results. The existing experimental workflow example provides an actual Abfig output and documents an unwanted bar-chart icon. That error illustrates why a convincing layout still needs inspection.
Use the existing workflow tool for a procedural draft
Open the scientific flowchart maker when your main task is arranging experimental steps. It produces an image draft, not editable flowchart nodes or a validated research plan. It cannot determine an appropriate control, calculate sample size or verify that a causal inference is justified.
If the author already has the design laid out, a rough sketch can guide composition. The output is a reinterpretation; labels, arrows and group structure may change. Choose a manual diagram editor when exact shapes, connectors or repeatedly editable text are essential.
For a paper-wide question, approach and finding, return to the graphical abstract maker. For a literature synthesis, use the review-paper guide. These tasks can share visual techniques without needing duplicate generator URLs.
Inspect relationships before styling
Trace each group from allocation to measurement. Check that labels are unchanged and that every arrow has a defined meaning. Confirm timing and readouts against the author’s source notes. Missing information must stay missing until the author supplies it.
Refine redraws the whole image, so an edit can change previously correct details. Inpaint redraws a brushed area rather than editing an independent object. Recheck the whole figure after either operation. Neither editing method verifies experimental design.
Finish with file checks: Abfig supports RGB PNG and TIFF with eligible paid access, while the DPI checker checks dimensions and resolution. It does not check group allocation, statistical validity or research integrity. Follow the exact journal’s current instructions, including its rules for AI imagery, before submission.
Review the journal policy first
Check the official journal guidance before using AI-generated imagery. If the policy is restrictive or unclear, do not submit an AI-generated figure.
Table of Contents
Author
Categories
Tags
More Posts
Frontiers Graphical Abstract Guidance: Check the Journal First
The general Frontiers author guide does not define one standalone graphical abstract specification. Check the exact journal page and current figure rules.
An experimental workflow diagram from a protocol, with a worked example
Turn experimental steps into a scientific flowchart, inspect branches and joins, and identify an unwanted chart icon in a real AI draft.
Sketch to Graphical Abstract with AI: Generate, Refine, and Inpaint
See a real sketch-to-image workflow, including full-image refinement and brush-mask local redraws.