Graphical Abstracts for Review Papers: Show the Synthesis
A review paper can have a clear contribution without a new laboratory experiment. Its graphical abstract should help a reader understand the question you examined, how the literature fits together, and what your synthesis supports. A collage of attractive images does not automatically communicate that contribution.
This guide concerns the content of a review’s visual summary, rather than a new template library. For general drawing steps, use the graphical abstract workflow. For layout choices, use the existing layout guide.
Choose the message before the layout
Complete this sentence using your own review: “Across the literature on ___, we organize ___ to explain ___, with uncertainty about ___.” If you cannot finish it without listing every section heading, narrow the scope of the image.
Different review types need different emphasis:
| Review task | What the image can explain | What to avoid |
|---|---|---|
| Narrative review | Relationships between themes, mechanisms or competing explanations | Presenting one preferred explanation as settled fact |
| Systematic review | The review question, evidence scope and supported synthesis | Replacing the conclusion with only a search-and-screening diagram |
| Scoping review | Where the literature clusters and which areas remain underrepresented | Treating a map of available studies as proof of an intervention’s effect |
| Meta-analysis | The question and accurately reported synthesis, if the journal permits that presentation | Asking an image generator to draw a forest plot or recreate numerical results |
These are editorial starting points, not universal journal rules. The European Respiratory Society’s author guidance, for example, distinguishes article types and visual approaches. Check the exact target journal before deciding what the file should contain.
A fictional example: review the methods, not an invented outcome
Imagine a narrative review about how studies describe sample preparation and measurement. There is no claim here about a treatment, no study count, and no pooled effect. The intended message is simply to compare how methods are reported.
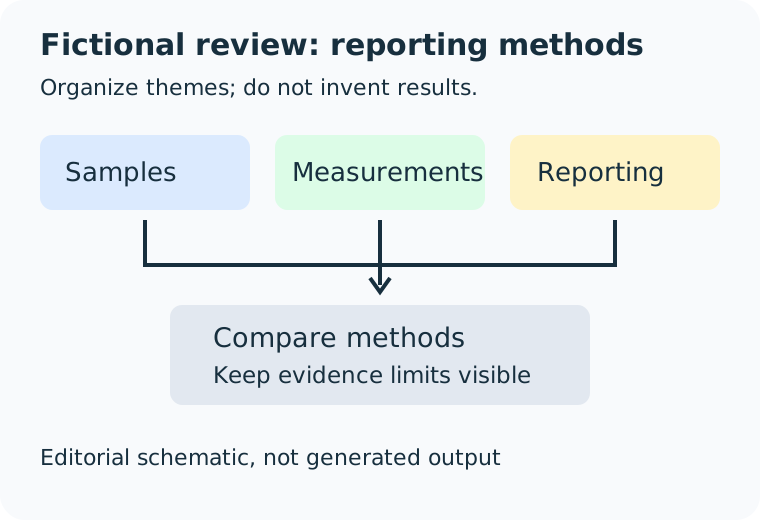
This is an editor-authored schematic, not an Abfig generation or a published research figure. It illustrates a way to organize the brief; it does not report a real review’s findings.
A source-to-visual plan could be:
| Source note from the author | Visual instruction | Verification |
|---|---|---|
| Three chosen themes are samples, measurements and reporting | Give the three themes equal visual weight | Do not imply a ranking or measured difference |
| The purpose is comparison of reporting methods | Connect themes to one synthesis box | Connections mean organization, not biological causation |
| Evidence limitations must remain visible | Reserve a short limitation statement | Fill it from the actual review, not model inference |
Turn the plan into a draft brief
For this fictional case, a drafting instruction could be:
Create a conceptual image for a fictional narrative review of methods reporting. Use three equal groups labeled Samples, Measurements and Reporting. Connect them to Compare methods. Do not include organisms, numerical results, charts, study counts or claims of effectiveness. Keep a clear reading order and leave room for a limitation supplied by the author.
This is a suggested input, not a tested generation result. Abfig can produce a raster draft from text or a sketch, but may add or change details. Inspect the entire output. If the relationship must remain exact or every text box must be editable, use an object-based illustration editor.
Try your own review brief in Abstract Maker. Supply only research you are authorized to send to the processing service. A draft does not establish scientific accuracy or permission to submit AI imagery.
Keep study selection separate from synthesis
A systematic-review flow diagram explains how records were identified, excluded and included. That can be useful in the paper, but it may not answer the same question as the graphical abstract. Decide whether the reader needs the selection process, the review’s conclusion, or both, according to the journal’s instructions.
Do not ask Abfig to infer missing screening counts or generate a reporting-standard diagram. Keep exact counts and statistical plots in the appropriate verified tools. If you are drawing a sequence of research actions instead, compare experimental design and workflow diagrams.
Check rights, labels and the saved file
Use your own composition. Before reusing an illustration from the reviewed literature, check its licence and any permission or attribution requirements. Linking to a paper is not the same as obtaining permission to reproduce its image. The Elsevier graphical abstract guide includes third-party material and journal-instruction checks.
Review every label against the manuscript. Make uncertainty visible without filling the figure with caveats. Check whether arrows mean sequence, association, organization or a proposed mechanism; do not silently turn one meaning into another.
Abfig exports RGB PNG and TIFF with eligible paid access. It does not produce editable vector objects or calculate review findings. Use the DPI checker for file dimensions and effective resolution, and the journal source directory to locate current guidance. Neither check validates your evidence synthesis or guarantees acceptance.
Review the journal policy first
Check the official journal guidance before using AI-generated imagery. If the policy is restrictive or unclear, do not submit an AI-generated figure.
Table of Contents
Author
Categories
Tags
More Posts
Why Was Your Graphical Abstract Returned? 7 Checks
Check journal-specific dimensions, resolution, legibility, format, density, permissions, and scientific focus before resubmitting.

ACS TOC Graphic Guidelines: Check the Exact Journal
ACS TOC-graphic requirements vary by journal. Use ACS Catalysis as a current cited example, then verify the exact title and article type.
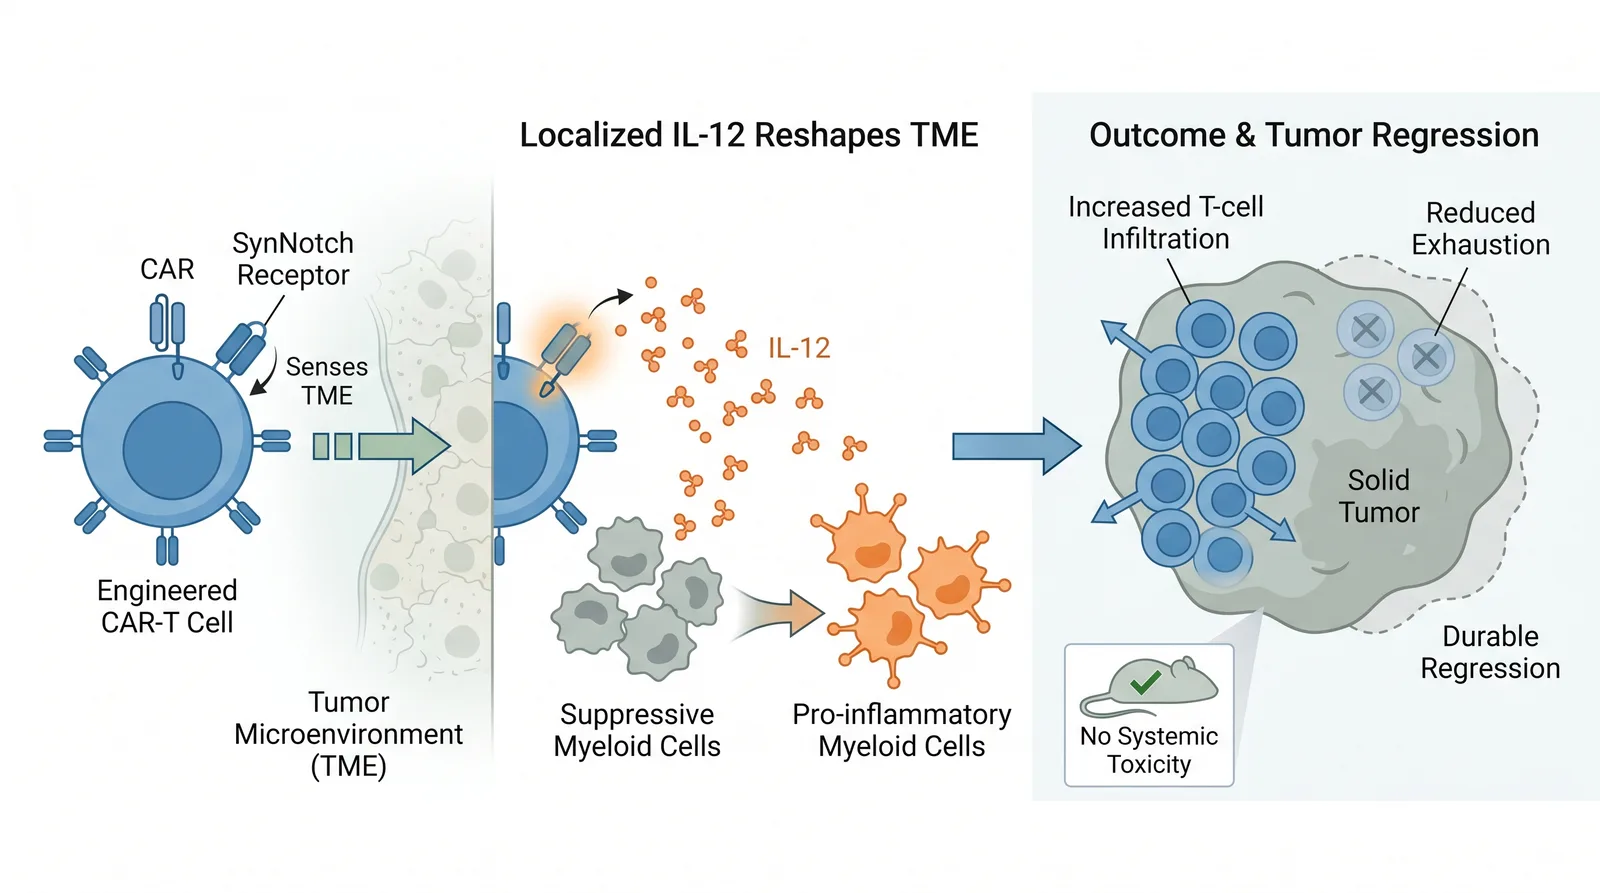
Graphical Abstract Examples: How to Analyze Layout and Hierarchy
Use illustrative Abfig drafts and official journal examples to study layout, hierarchy, labels, and visual flow.